Social Media Analytics API: The Complete Guide to Unified Cross-Platform Metrics (2026)
Learn how to pull unified analytics from Instagram, TikTok, YouTube, LinkedIn, and more through a single API. Complete guide with code examples.

The Analytics Fragmentation Problem
You manage social media presence across Instagram, TikTok, YouTube, LinkedIn, and Twitter. Each platform has its own analytics dashboard. Each defines metrics differently. Each requires separate logins, separate exports, and separate mental models.
Your boss asks a simple question: "How did we perform last month?"
You spend the next three hours:
- Logging into five platforms
- Exporting CSVs with different column names
- Trying to reconcile why Instagram calls it "Reach" and LinkedIn calls it "Unique Impressions"
- Building a spreadsheet that's outdated the moment you finish it
This is the reality for most marketing teams. And if you're a developer trying to build analytics into your product, it's even worse - you're dealing with five different APIs, five different authentication flows, and five different data schemas.
A social media analytics API solves this by providing unified access to metrics across platforms through a single interface. But not all analytics APIs are created equal. This guide covers what you need to know - whether you're evaluating tools, building your own dashboard, or trying to understand what's actually possible.
What Is a Social Media Analytics API?
A social media analytics API is a programmatic interface that lets you pull performance metrics from social media platforms. Instead of manually checking dashboards or exporting CSVs, you make API calls and receive structured data.
At its simplest:
# Instead of logging into Instagram, TikTok, YouTube...
# Make one API call
analytics = api.get_analytics(account_id="abc123")

# Get unified metrics
print(analytics.impressions)      # 1,234,567
print(analytics.engagement_rate)  # 4.2%
print(analytics.followers)        # 50,000
The power is in automation and aggregation:
- Automation: Pull metrics programmatically on a schedule, no manual work
- Aggregation: Combine data from multiple platforms into unified reports
- Historization: Store historical data that platforms often don't preserve long-term
- Normalization: Translate platform-specific metrics into comparable formats
Why Platform-Native Analytics Aren't Enough
Every social platform offers some form of analytics. Instagram has Insights. TikTok has Analytics. YouTube has Studio. So why would you need an API?
1. Manual Access Doesn't Scale
If you manage one account, native dashboards work fine. If you manage 10 accounts across 5 platforms, you're spending hours on data collection that should be automated.
2. Data Retention Is Limited
Most platforms only retain detailed analytics for 30-90 days. If you need to compare this January to last January, that data is gone unless you've been exporting it.
3. Cross-Platform Comparison Is Painful
Try comparing "engagement rate" across platforms. Instagram calculates it one way. LinkedIn calculates it another. TikTok doesn't even provide it directly - you have to compute it yourself. Without normalization, you're comparing apples to oranges.
4. Building Features Requires APIs
If you're building a SaaS product, a client dashboard, or an internal reporting tool, you can't tell users to "just check Instagram manually." You need programmatic access.
5. Executive Reporting Needs Aggregation
Leadership doesn't want five separate reports. They want one dashboard that shows total reach, total engagement, and growth trends across all channels.
The Challenge: Every Platform Is Different
Before diving into solutions, you need to understand the problem. Each platform's analytics API is its own world.
Instagram (Graph API)
Available Metrics:
- Profile: impressions, reach, profile views, website clicks, followers
- Posts: impressions, reach, likes, comments, saves, shares (Reels only)
- Stories: impressions, reach, exits, replies, taps forward/back
- Reels: plays, reach, likes, comments, shares, saves
Demographics Available:
- Follower breakdown by country, city, age, gender
- Engaged audience breakdown (who interacted this month)
- Follows/unfollows over time
Limitations:
- Story metrics available only for 24 hours after story expires
- Demographics require Business/Creator account
- 30-day rolling window for most historical data
TikTok (Business API)
Available Metrics:
- Profile: video views, followers, profile views, likes (total)
- Videos: views, likes, comments, shares, watch time, completion rate
Demographics Available:
- Audience ages
- Audience cities
- Engaged audience breakdown
Limitations:
- Requires Business Account
- API approval process takes weeks
- Some metrics only available in aggregate (30-day windows)
YouTube (Data API v3)
Available Metrics:
- Channel: views, subscribers, video count, estimated watch time
- Videos: views, likes, dislikes, comments, favorites, average view duration
Demographics Available:
- Viewer age groups
- Viewer gender
- Traffic sources
- Geography
Limitations:
- Quota system limits API calls (10,000 units/day default)
- Video upload costs 1,600 units - analytics calls cost less but add up
- Detailed demographics require YouTube Analytics API (separate)
LinkedIn (Marketing API)
Available Metrics (Personal):
- Posts: impressions, unique impressions, reactions, comments, reshares
- Videos: video plays, viewers, watch time, completion rate, average watch time
Available Metrics (Company Pages):
- Page: page views, unique visitors, followers
- Posts: impressions, clicks, engagement rate, reactions, comments, shares
Limitations:
- Personal and company analytics are completely different APIs
- Rate limits are restrictive
- Historical data access is limited
Facebook (Graph API)
Available Metrics:
- Page: page views, page impressions, followers
- Posts: impressions, reach, reactions (like, love, wow, haha, angry), comments, shares, saves
- Videos: views, unique views, average watch time, click-to-play
- Reels: plays, reach, reactions
Limitations:
- Organic vs. paid metrics are separate
- Video metrics differ significantly from photo/link posts
- Requires Page access tokens (more complex OAuth)
And That's Just Five Platforms...
Pinterest has pin impressions, saves, and outbound clicks. Reddit has karma, upvotes, and comment counts. Threads has views, likes, reposts, and quotes. Google Business Profile tracks impressions across maps and search, plus calls and direction requests.
Each platform:
- Uses different terminology
- Measures things differently
- Has different API access requirements
- Returns data in different formats
This is why unified analytics APIs exist.
What a Good Social Media Analytics API Should Provide
When evaluating social media analytics APIs, here's what matters:
1. Normalized Metrics Across Platforms
The API should translate platform-specific metrics into a consistent schema:
| Normalized Field | TikTok | YouTube | ||
|---|---|---|---|---|
impressions | impressions | video_views | views | impressions |
impressionsUnique | reach | unique_views | (N/A) | unique_impressions |
likes | likes | likes | likes | reactions |
comments | comments | comments | comments | comments |
shares | shares | shares | (N/A) | reshares |
saves | saved | (N/A) | favorites | (N/A) |
followers | followers_count | followers | subscribers | followers |
This lets you compare performance across platforms without mental gymnastics.
2. Both Account-Level and Post-Level Analytics
Account-level (social account analytics):
- Follower growth
- Total impressions/reach
- Overall engagement
- Profile/page views
Post-level (content analytics):
- Per-post impressions, likes, comments
- Video-specific metrics (watch time, completion rate)
- Content performance comparison
You need both to understand channel health AND content performance.
3. Raw Data Access
Normalized data is great for dashboards. But sometimes you need the raw platform response - every field, exactly as the platform returned it.
Why raw data matters:
- Platform-specific metrics that don't normalize well
- Debugging discrepancies between your data and native dashboards
- Future-proofing (if a new metric appears, raw data captures it)
- Custom calculations beyond standard normalization
A good analytics API stores both normalized AND raw responses.
4. Demographic and Audience Data
Beyond engagement metrics, you need to understand WHO your audience is:
Demographics:
- Age breakdown
- Gender breakdown
- Geographic distribution (country, city)
Audience Insights:
- Follower vs. engaged audience differences
- Audience growth over time
- Audience overlap across platforms
This data is essential for content strategy, ad targeting, and understanding market fit.
5. Historical Data Retention
Platforms often only keep 30-90 days of detailed analytics. A good analytics API should:
- Store historical data long-term
- Let you query trends over months/years
- Preserve data even after platform retention expires
6. Automatic Refresh and Webhooks
Analytics data changes constantly. A good API should:
- Automatically refresh metrics on a configurable schedule
- Support force-refresh when you need real-time data
- Send webhooks when significant changes occur
How bundle.social Handles Analytics
Let me walk you through what we've built. This isn't just marketing - it's the technical reality of our analytics infrastructure.
Platforms We Cover
We pull analytics from 11 platforms:
- Instagram - full suite including demographics
- TikTok - account and video analytics with audience data
- YouTube - channel and video metrics
- LinkedIn - personal AND company page analytics
- Facebook - page and post analytics including Reels
- Threads - views, likes, replies, reposts
- Pinterest - impressions, saves, clicks
- Reddit - karma, upvotes, comments
- Google Business Profile - impressions, calls, direction requests
- Mastodon - followers, favourites, reblogs
- Bluesky - followers, likes, reposts
Normalized Schema
Every platform maps to our unified schema:
// Account-level analytics
{
  impressions: number,
  impressionsUnique: number,
  views: number,
  viewsUnique: number,
  likes: number,
  comments: number,
  postCount: number,
  followers: number,
  following: number,
  createdAt: timestamp,
  updatedAt: timestamp
}

// Post-level analytics
{
  impressions: number,
  impressionsUnique: number,
  views: number,
  viewsUnique: number,
  likes: number,
  dislikes: number,
  comments: number,
  shares: number,
  saves: number,
  raw: object  // Original platform response
}
This lets you run queries like "show me total engagement across all platforms" without platform-specific logic.
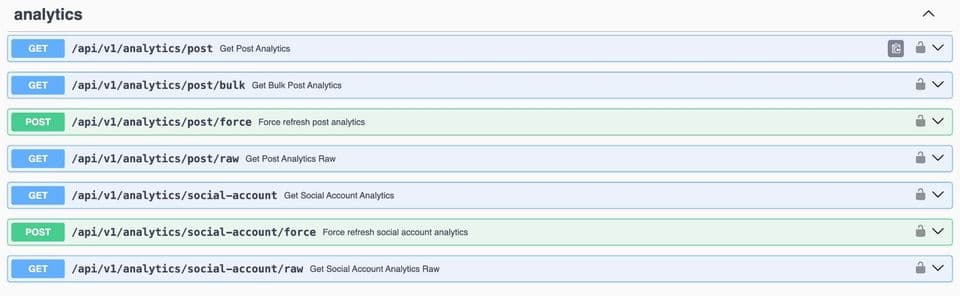
Raw Analytics Storage
We store the complete, unmodified platform response alongside normalized data. When you need it:
GET /api/v1/analytics/social-account/raw?socialAccountId=abc123
Returns everything the platform sent - audience ages, cities, engaged audience breakdowns, platform-specific metrics that don't fit our normalized schema.
Configurable per organization:
rawTiktokAnalyticsEnabled- store complete TikTok response including demographicsrawInstagramDemographicsEnabled- store follower demographics, audience splits, follows/unfollows
Instagram Demographics Deep Dive
When enabled, we capture Instagram's full demographic breakdown:
Follower Demographics:
{
  "follower_demographics": {
    "country": [
      {"code": "US", "value": 45.2},
      {"code": "UK", "value": 12.8},
      {"code": "CA", "value": 8.1}
    ],
    "city": [
      {"name": "Los Angeles", "value": 8.4},
      {"name": "New York", "value": 7.2},
      {"name": "London", "value": 5.1}
    ],
    "age": [
      {"range": "18-24", "value": 28.5},
      {"range": "25-34", "value": 42.1},
      {"range": "35-44", "value": 18.3}
    ],
    "gender": [
      {"type": "female", "value": 62.4},
      {"type": "male", "value": 36.1},
      {"type": "other", "value": 1.5}
    ]
  }
}
Engaged Audience (This Month): Same breakdown, but for people who actually interacted with your content - not just followers. This is powerful for understanding whether your content resonates with your target demographic.
Follows/Unfollows Trend: Daily data showing follower gains and losses over a 30-day window. Essential for correlating content strategy with audience growth.
TikTok Audience Insights
When raw TikTok analytics are enabled:
{
  "audience_ages": [
    {"age_range": "18-24", "percentage": 35.2},
    {"age_range": "25-34", "percentage": 28.7}
  ],
  "audience_cities": [
    {"city": "Los Angeles", "percentage": 12.1},
    {"city": "New York", "percentage": 9.8}
  ],
  "engaged_audience": {
    // Breakdown of who actually engaged
  }
}
LinkedIn Video Analytics
LinkedIn provides rich video metrics that we capture:
{
  "video_analytics": {
    "views": 15234,
    "unique_viewers": 12891,
    "watch_time_seconds": 45678,
    "average_watch_time_seconds": 3.2,
    "completion_rate": 0.42,
    "engagement_rate": 0.058
  }
}
This lets you understand not just IF people watched, but HOW they watched - crucial for video content strategy.
Bulk Analytics Retrieval
When you need analytics for many posts at once:
GET /api/v1/analytics/post/bulk?postIds=id1,id2,id3...&limit=60
Paginated response for up to 60 posts per request. Essential for building dashboards and reports.
Force Refresh
Platform analytics update on their own schedule. When you need real-time data:
POST /api/v1/analytics/social-account/force
POST /api/v1/analytics/post/force
Force refreshes are rate-limited per organization to prevent abuse.
Configurable Refresh Intervals
Different use cases need different freshness:
analyticsInterval- how often we automatically refresh account analyticsanalyticsPostsInterval- how often we refresh post analytics
Configure based on your needs. Real-time dashboard? Refresh frequently. Monthly reports? Daily refresh is fine.
Code Examples: Using the Analytics API
Get Account Analytics (Node.js)
Using our SDK:
import { BundleSocial } from 'bundlesocial';

const client = new BundleSocial({ apiKey: 'YOUR_API_KEY' });

async function getAccountAnalytics(socialAccountId: string) {
  const analytics = await client.analytics.getSocialAccount({
    socialAccountId
  });

  console.log(`Followers: ${analytics.followers}`);
  console.log(`Impressions: ${analytics.impressions}`);
  console.log(`Engagement: ${analytics.likes + analytics.comments}`);
  console.log(`Last updated: ${analytics.updatedAt}`);
}
Get Post Analytics (Python)
import requests

API_KEY = "YOUR_API_KEY"
BASE_URL = "https://api.bundle.social/api/v1"

def get_post_analytics(post_id: str):
    response = requests.get(
        f"{BASE_URL}/analytics/post",
        headers={"x-api-key": API_KEY},
        params={"postId": post_id}
    )

    data = response.json()

    print(f"Impressions: {data['impressions']}")
    print(f"Likes: {data['likes']}")
    print(f"Comments: {data['comments']}")
    print(f"Shares: {data['shares']}")
    print(f"Saves: {data['saves']}")

    return data

def get_raw_analytics(post_id: str):
    """Get the complete platform response"""
    response = requests.get(
        f"{BASE_URL}/analytics/post/raw",
        headers={"x-api-key": API_KEY},
        params={"postId": post_id}
    )

    # Returns everything the platform sent
    return response.json()
Bulk Analytics for Reporting
def get_bulk_analytics(post_ids: list):
    """Get analytics for multiple posts at once"""
    response = requests.get(
        f"{BASE_URL}/analytics/post/bulk",
        headers={"x-api-key": API_KEY},
        params={
            "postIds": ",".join(post_ids),
            "limit": 60
        }
    )

    data = response.json()

    # Aggregate metrics
    total_impressions = sum(p['impressions'] for p in data['items'])
    total_engagement = sum(p['likes'] + p['comments'] for p in data['items'])

    print(f"Total impressions: {total_impressions}")
    print(f"Total engagement: {total_engagement}")
    print(f"Average engagement per post: {total_engagement / len(data['items']):.1f}")

    return data
Cross-Platform Comparison
def compare_platforms(account_ids: dict):
    """
    account_ids = {
        "instagram": "ig_account_id",
        "tiktok": "tt_account_id",
        "youtube": "yt_account_id"
    }
    """
    results = {}

    for platform, account_id in account_ids.items():
        analytics = requests.get(
            f"{BASE_URL}/analytics/social-account",
            headers={"x-api-key": API_KEY},
            params={"socialAccountId": account_id}
        ).json()

        results[platform] = {
            "followers": analytics["followers"],
            "impressions": analytics["impressions"],
            "engagement": analytics["likes"] + analytics["comments"]
        }

    # Now you can compare normalized data across platforms
    print("\n--- Cross-Platform Comparison ---")
    for platform, metrics in results.items():
        print(f"{platform.upper()}")
        print(f"  Followers: {metrics['followers']:,}")
        print(f"  Impressions: {metrics['impressions']:,}")
        print(f"  Engagement: {metrics['engagement']:,}")
Use Cases: What You Can Build
1. Client Reporting Dashboards
Agencies managing multiple clients can build automated reports:
- Pull analytics for all client accounts nightly
- Generate weekly/monthly PDF reports
- Show cross-platform performance in one view
- Track trends over time
2. Content Performance Analysis
Compare how content performs across platforms:
- Same video on TikTok vs. Reels vs. Shorts
- Which platform drives the most engagement?
- Optimal posting times per platform
- Content type performance (video vs. image vs. carousel)
3. Audience Intelligence
Use demographic data to understand your audience:
- Age and gender breakdown per platform
- Geographic distribution
- Difference between followers and engaged audience
- Audience growth/churn analysis
4. Competitive Benchmarking
Compare your performance to industry benchmarks:
- Track engagement rates over time
- Compare follower growth rates
- Identify high-performing content patterns
5. Automated Alerts
Build notification systems:
- Alert when engagement drops below threshold
- Notify when a post goes viral (unusual spike)
- Weekly digest of top-performing content
- Follower milestone notifications
6. Executive Dashboards
Give leadership what they need:
- Total reach across all platforms
- Month-over-month growth
- Top-performing content
- ROI metrics (when combined with campaign data)
bundle.social
Start building with our Social Media API
One API to schedule, publish manage and analyze content across your social media channels at scale.
Extending Analytics: What We Can Add
Our analytics foundation is built to expand. Current capabilities are extensive, but we're continuously adding:
Coming soon / available on request:
- Sentiment analysis - Understanding comment sentiment at scale
- Hashtag performance tracking - Which hashtags drive reach
- Competitor analytics - Track public metrics for competitor accounts
- Custom metric calculations - Define your own engagement rate formulas
- Deeper video analytics - Second-by-second retention curves
- Audience overlap - Understanding follower overlap across platforms
If you have specific analytics needs not covered by our current offering, reach out. We're actively building based on customer requirements.
Why Not Build It Yourself?
You could build direct integrations to each platform's analytics API. Here's why that's usually a bad idea:
Time Investment
| Platform | Analytics Integration Time |
|---|---|
| 30-40 hours | |
| TikTok | 25-35 hours |
| YouTube | 35-45 hours |
| 30-40 hours | |
| 25-35 hours | |
| Total | 145-195 hours |
Plus: different OAuth flows, different rate limits, different data formats, ongoing maintenance.
Maintenance Burden
- Instagram Graph API changes quarterly
- TikTok deprecated their old API entirely
- LinkedIn's analytics endpoints shift regularly
- You're responsible for handling every breaking change
Data Normalization Is Hard
Getting "engagement" to mean the same thing across platforms requires:
- Deep understanding of each platform's metrics
- Careful mapping decisions
- Ongoing adjustment as platforms add/change metrics
Storage and Historization
Platforms don't keep historical data forever. Building your own data warehouse adds:
- Database infrastructure
- Data retention policies
- Backup and recovery
Getting Started
If you're ready to stop wrestling with multiple analytics dashboards:
<Card title="API Documentation" icon="book" href="/api-reference/introduction"> Full API reference for analytics endpoints </Card> <Card title="GitHub Examples" icon="github" href="/api-reference/examples"> Working code samples for analytics </Card> <Card title="Sign Up" icon="rocket" href="https://bundle.social"> Connect your accounts and start pulling analytics </Card>Contact us to enable demographic data and raw analytics storage for your organization.
The Bottom Line
Social media analytics shouldn't require logging into five dashboards, exporting five CSVs, and spending hours in spreadsheets.
A unified social media analytics API gives you:
- One interface for all platforms
- Normalized data for easy comparison
- Raw data when you need the details
- Demographics to understand your audience
- Historical retention beyond platform limits
- Programmatic access for automation and reporting
The question isn't whether you need unified analytics - it's whether you'll build it yourself or use an existing solution.
We've already built it. The data is there. What will you do with it?
Questions about specific analytics capabilities? Check our analytics beginner guide or reach out. We're happy to discuss what's possible.